A multiplex fluorescent PCR protocol, including simultaneous testing of the DYT1 gene mutation and a set of linked polymorphic markers, is used for early-onset primary dystonia (PD), an autosomal dominant disorder caused, in most of the cases, by a 3bp deletion (codon 302) in the DYT1 gene. Mutation analysis was performed simply by sizing PCR fragments, detecting the affected alleles because of the 3bp difference from the normal allele (Figure 2).
Because this mutation is responsible for more than 70% of PD cases, the PGD strategy used can be applied for most of patients without the need for extensive preclinical preparatory work.
Figure 2.
Preimplantation genetic diagnosis (PGD) for Primary dystonia (PD).
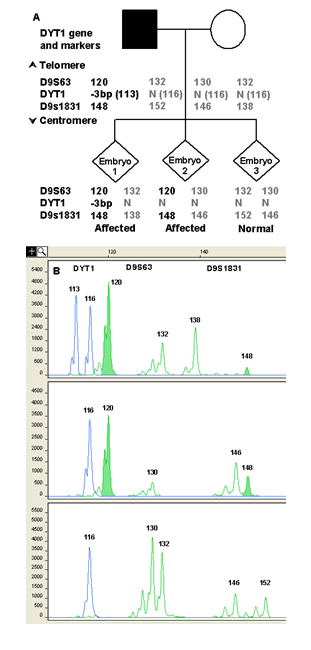
A) Haplotyping results of STR markers linked to DYT1 gene are numbered according to the size in base pair (bp). Numbers in bold represent alleles linked to the mutation. Examples of different results of DYT1 mutation analysis from biopsied blastomeres are shown in the lower panel.
B) Capillary electrophoresis of fluorescent polymerase chain reaction (PCR) products obtained after multiplex amplification of the DYT1 region involved by mutation and a set of linked polymorphic markers.
The x-axis shows the length of PCR products in bp and the y-axis shows the fluorescence intensity in Relative Fluorescence Units (RFU). Mutation analysis was performed by determining the size of the PCR fragments, detecting the affected alleles (113 bp peak) because of the 3bp difference from the normal allele (116 bp peak).
On top of the electropherogram the marker name is located above the corresponding alleles (peaks). Numbers next to each peak represent the size of the allele (in bp). Alleles linked to the mutation are highlighted in green.
The upper lane shows the results of an affected embryo (embryo 1). An affected embryo (embryo 2) in which the mutated allele (113 bp peak) of DYT1 gene has dropped out is shown in the middle lane. Allele drop-out occurrence has been evidenced from the presence of the affected haplotype (highlighted peaks).
The lower lane shows the profile of a healthy embryo (embryo 3).